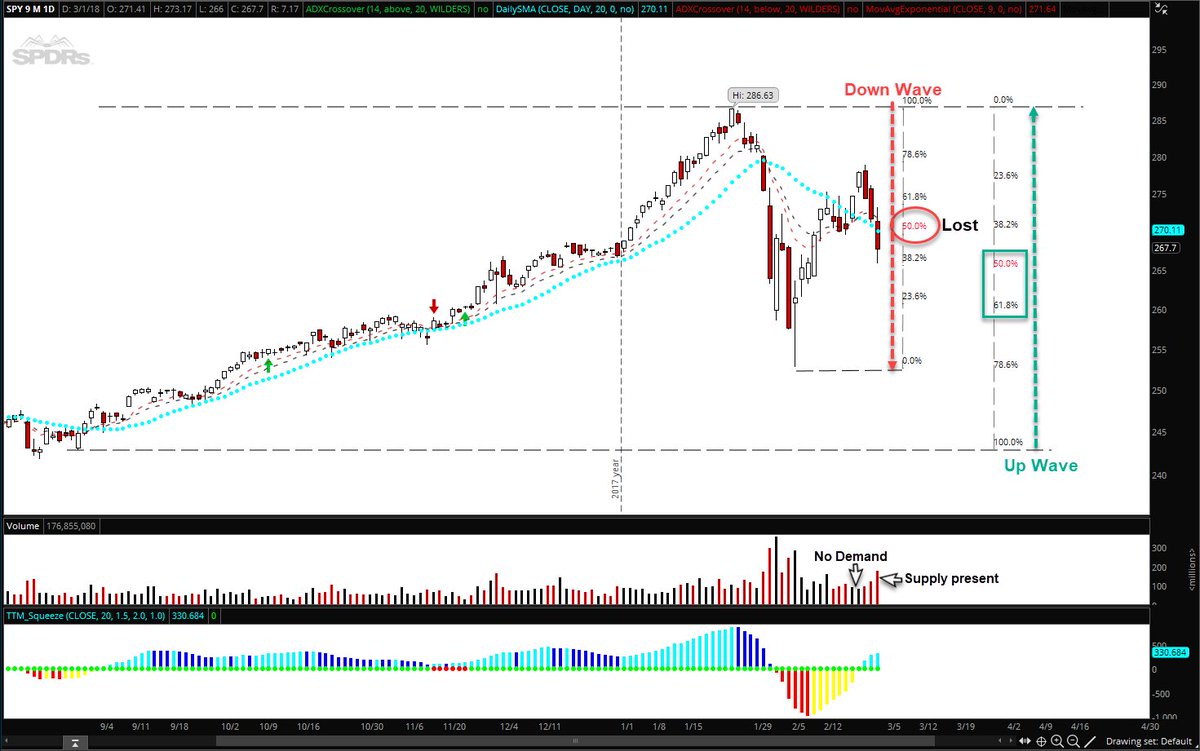
SPY losing the 50% retracement of the downwave brings the 50% and 61.8% retracement of the larger upwave into the picture. The present countertrend continues to be bearish as the 20 sma as well as the 8 &13 ema are falling.
SPX possible short-term path: So much for the H&S on the 1-hour chart.
SPX longer time frame path: consolidate here through time, even retest the 200d would be good IMO. Build a base on the weekly chart after 2017’s rip and allow individual names to show their strength or weakness

NFLX Daily chart It’s the King! If you’ve played chess, you know when the King goes, it’s game over. Well, he’s still standing.

PLNT long over 38

HD Daily chart Hasn’t gone up since late January. It’s been going sideways at best since. Holding during an uptrend makes you money. Holding during a sideways market wastes your time. Holding during a downtrend wastes your money.

BABA Daily chart Broke the uptrend line and fell back below the horizontal line on Tuesday. It’s not falling on that heavy of volume so it’s a watch over the next few days to see if it holds up. If the market turns, money may flow here.

AAPL daily chart Just made new highs yesterday, so it’s still fine. May go sideways for a bit. Who knows though, so let’s see tomorrow. I’ve seen a lot worse charts.

GOOGL Daily chart Broke above the $1087 bar on light volume and fell back below on heavier volume.

UPS downside DeMark exhaustion today. Will be on today’s Hedge Fund Telemetry daily note as a new long idea.

Bitcoin BTC so far this week, went from the Weekly Pivot(WP) to the WR1 Pivot. Know in advance where the key pivots are

TSLA

SNAP looks interesting here
